Gameplan Team Overview |
|

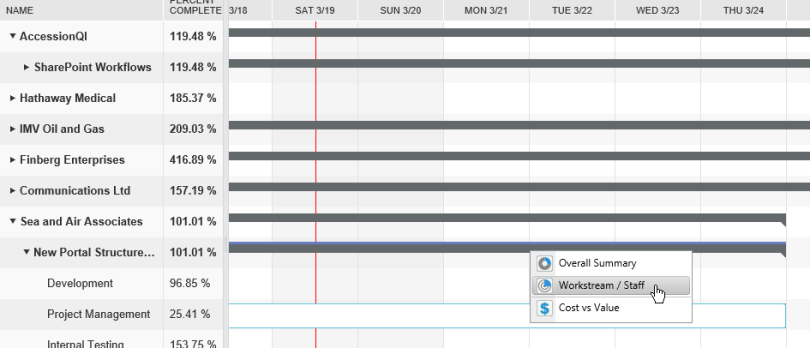
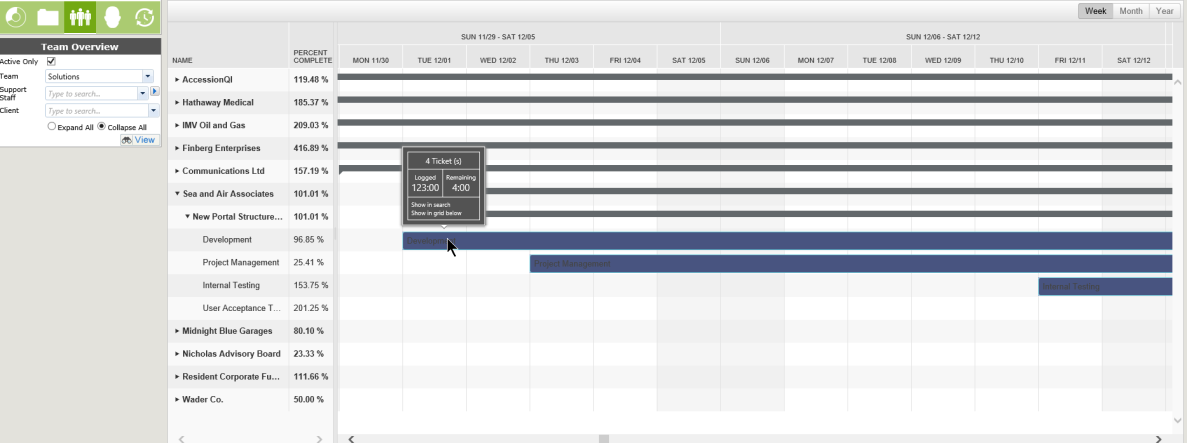
This Overview provides a view by Week, Month or Year. If you hover Workstream bar, you will be given three options:
Overall Summary: Brings up the chart you would see on the Dashboard home page
Workstream/Staff: A chart showing the percentages of the various Workstreams; Person shows which staff members have worked on the project and the percentage of time.
Cost vs Value: Based on the costs initially added to the project, shows how much it has cost based on Roles, etc. and the value based on the client cost.

If the Workstream is expanded, hovering over the bar will bring a pop up with the number of tickets for the Workstream, and the hours logged and remainingFrom that pop up, you will also have the option to show the associated tickets in a Search page or in a grid below the chart.


